Why doesn’t a brand with an average 5-star rating always rank first on the hotel brand leaderboard?
This walkthrough follows the complete pipeline using public benchmark questions: Data → Question → Solution → Validation. The focus is not merely on calculating the answer, but on understanding how qualification thresholds and denominator selection alter conclusions.
Data and Questions
The dataset is InfiAgent-DABench, which evaluates the ability to truly execute analysis and deliver results starting from CSV files, natural language questions, and constraints. This fixed question set contains 257 questions referencing 52 CSV files; here, we use only hotel_data.csv, comprising 1,057 rows and 9 columns, covering 7 cities and 103 non-null brands, with each row representing a hotel record.
We selected two medium-difficulty questions: 510 and 513.
510: Among hotels with at least 100 reviews, which brand has the highest average star rating? Requirements include non-null values for brand and star rating, a minimum of 10 hotels per brand in the full table, calculation via arithmetic mean, and resolution of ties by total brand scale.
513: What is the correlation between review count and bubble_score within different star-rating groups? Note that bubble_score and hotel star rating are distinct fields.
Both questions include constraints, making them closer to real-world work than simply “calculating an average”: constraints determine who qualifies for participation and define the denominator.
Solution: Splitting Question 510 into Two Paths
The first path calculates brand scale across the full table to determine eligibility; the second filters valid hotels to compute the sum and mean of star ratings. Finally, results are aggregated at the brand level.
Filtering Path:
| Step | Row Count | Description |
|---|---|---|
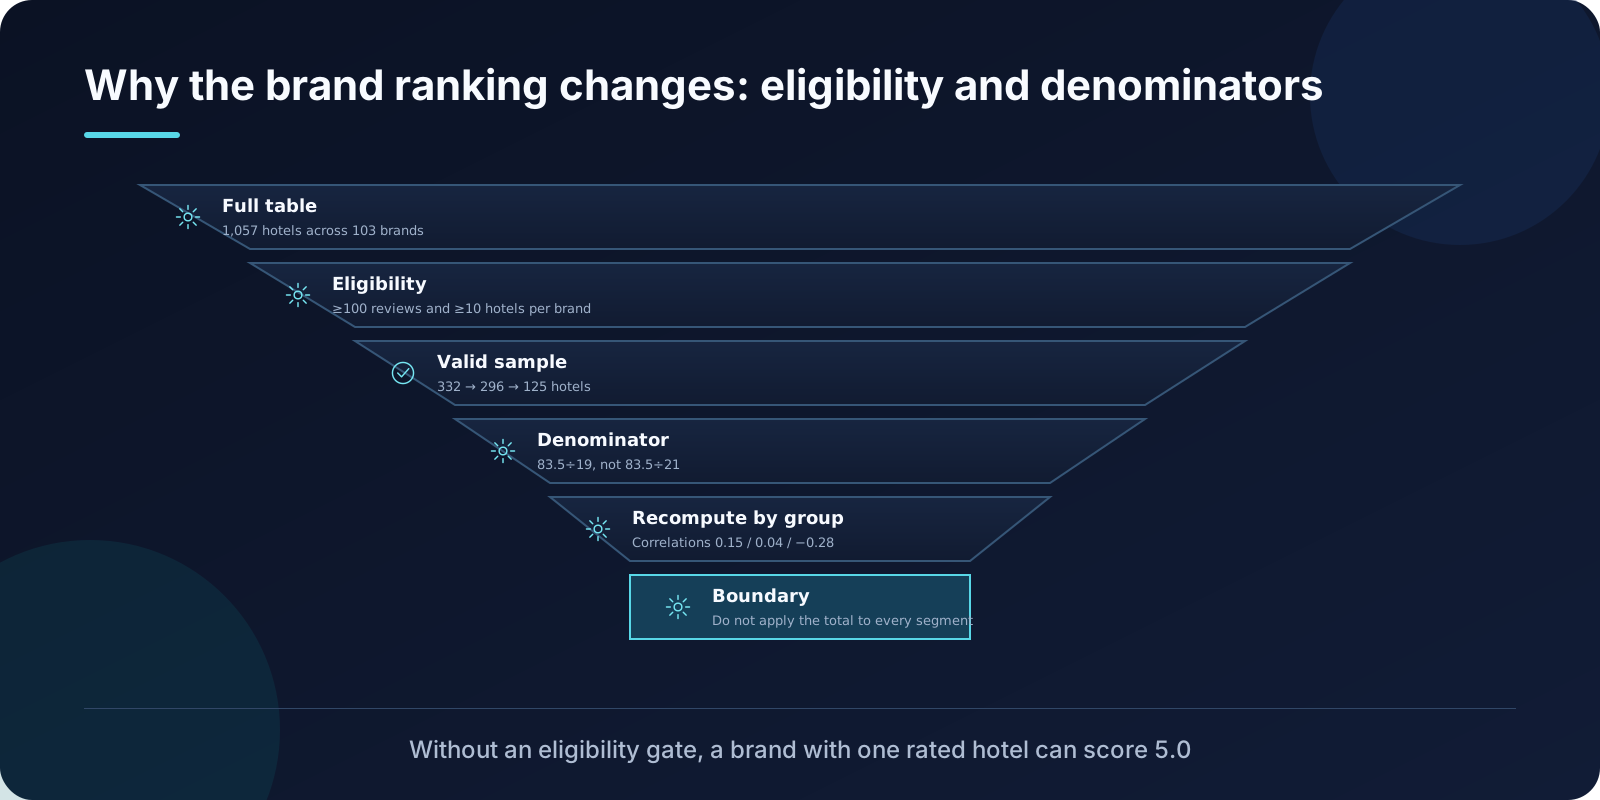
| Full Table | 1,057 | All hotel records |
| Brand Scale ≥ 10 Hotels | — | Determine eligible brands |
| Star Rating and Brand Non-Null | 332 | Records with required rating fields |
| Review Count ≥ 100 and Star/Brand Non-Null | 296 | Records meeting hotel-level criteria |
| Final Participation After Applying Brand Scale Threshold | 125 Hotels / 6 Brands | Simultaneously meeting brand and hotel-level criteria |
The top-ranked brand, Preferred Hotels & Resorts, has 21 hotels in the full table. Of these, 19 participated in the rating calculation, with a star rating sum of 83.5, yielding a mean of 83.5 ÷ 19 = 4.3947.
The Critical Role of the Denominator
The most common error here is using 21 as the denominator.
83.5 ÷ 21 = 3.976, which would significantly lower the ranking. However, 21 represents the “total hotels in the full table,” while 19 represents “hotels with valid ratings.” The question asks for the average star rating of hotels with at least 100 reviews; therefore, the denominator must be 19.
This is not an arithmetic detail but a matter of defining qualification and the denominator. Dividing the sum of star ratings for qualified hotels by a larger total hotel count systematically depresses scores for brands with lower participation rates in the eligible sample. Excluded records may not lack star ratings; they might simply fail to meet the review count threshold.
What Happens Without Thresholds
Without the brand scale threshold, a brand with only one rated sample could achieve a 5.0 score and immediately top the list.
This phenomenon is common in small-sample leaderboards: fewer samples increase the likelihood of extreme values. The purpose of thresholds is not to make results look better, but to ensure comparisons occur under equal qualifications.
The constraint in the original question stating “brands must have at least 10 hotels in the full table” specifically aims to exclude such randomness. It also highlights another point: qualification rules should be defined within the question, not adjusted after results are generated.
Question 513: Rebuild Samples; Do Not Reuse
Question 513 asks for the correlation between review count and bubble_score across different star-rating groups.
A common error is directly reusing the 125-sample set from Question 510. However, since Question 513 groups by star rating, samples for each group must be reconstructed; results from the previous question’s filtering cannot be reused.
The correlation coefficients for the three star-rating groups are 0.15, 0.04, and −0.28, respectively. The overall correlation coefficient cannot be directly applied to each group: inter-group differences are significant, with one group even showing a negative correlation.
This explains why “overall conclusions” and “grouped conclusions” often conflict. They are not answering the same question.
Clear Skill Division of Labor
This recalculation utilized five Skills, each with specific responsibilities:
| Skill | Responsibility | Output |
|---|---|---|
gather-business-context | Confirm question intent and field meanings | Definition clarification |
analyze-data-quality | Check IDs, missing values, and granularity | Input validation log |
jupyter-notebooks | Execute two-path aggregation | Reproducible calculation record |
visualize-data | Present filtering, rankings, and valid n | Charts |
validate-data | Independently verify results via SQL | Validation record |
Note: This represents a responsibility mapping organized by Skill specifications, not an automatic invocation log; actual calculations were executed via SQL and Python.
Conclusion Boundaries
This is a teaching recalculation using public data where answers are already visible; it is not a blind test. Several judgments require explicit annotation:
- The brand scale threshold was applied per question constraints, not selected by the analyst.
- Star rating means were calculated via arithmetic average, not weighted by review count.
- Samples for Question 513 were independently reconstructed and did not reuse filtering results from Question 510.
- Correlation coefficients describe only the strength of linear relationships and do not imply causality.
Three Transferable Insights
First, qualification precedes calculation. In any leaderboard, scoring, or ranking analysis, clearly define who qualifies for participation before discussing who ranks first.
Second, the denominator must follow the question. The same numerator yields different conclusions with different denominators; the choice of denominator must be traceable to the question definition.
Third, rebuild samples for grouping. When a question shifts from “overall” to “by group,” samples, filters, and definitions may all need to be redone; direct reuse is the most common source of error.
References: InfiAgent-DABench Dataset · OpenAI Data Analytics Skills Public Reference Repository