If a table has no nulls and no duplicates, can you confidently publish the analysis?
Not necessarily. Even if the data is entirely correct, the calculation might be wrong; even if calculated correctly, the comparison might be flawed, or correlation might be mistaken for causation. These three types of failures occur at different stages and require distinct checks to catch them.
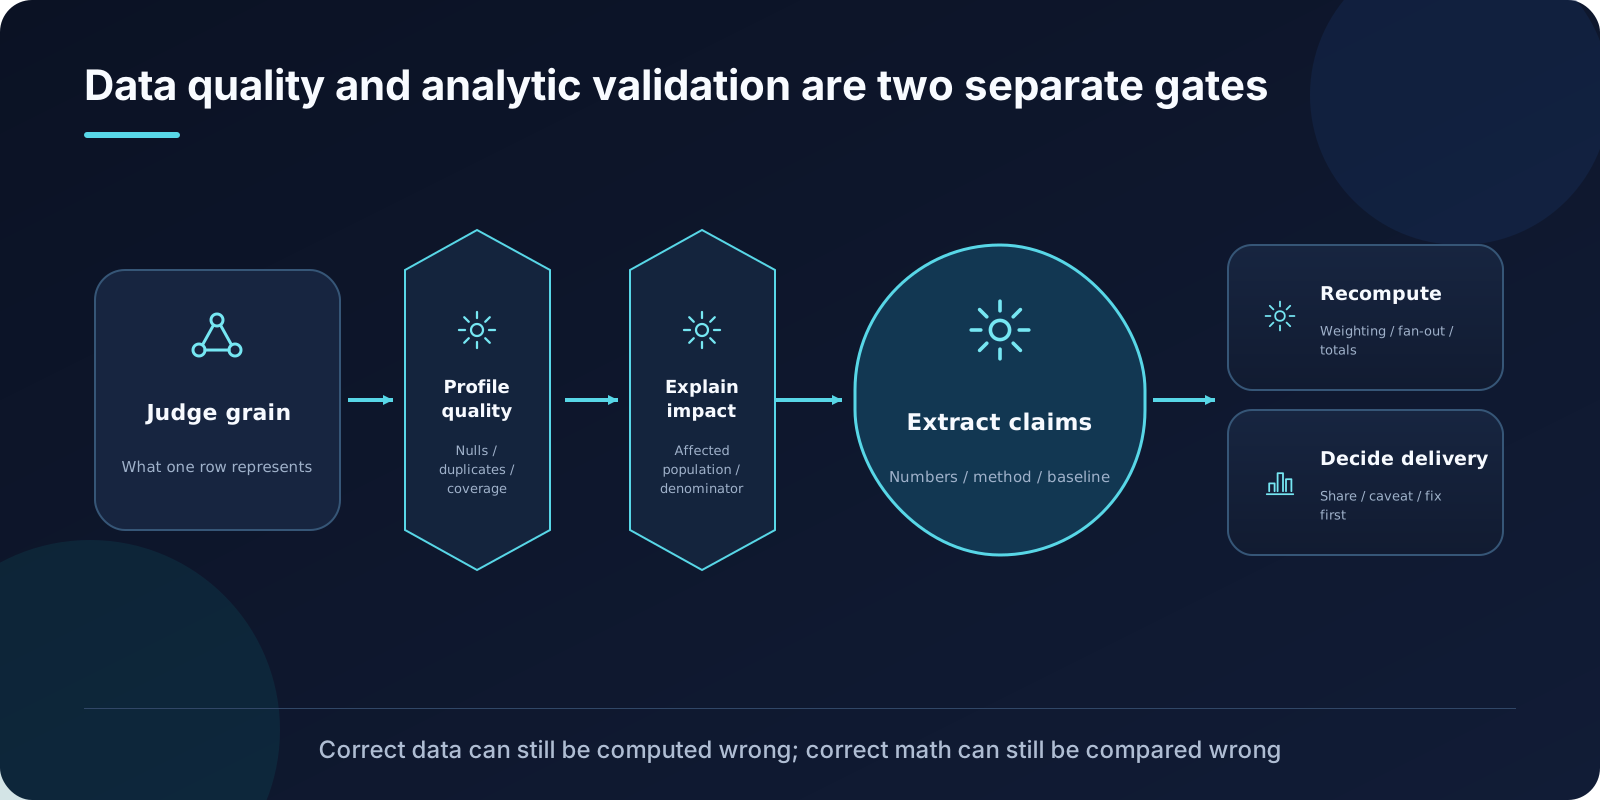
Data Analytics Skills divides these into two skills: Analyze Data Quality to check the data, and Validate Data to check the analysis. These two gates guard against different risks; missing either one leads to leakage.
First, ask if the data fits this specific use case
The starting point of Analyze Data Quality is not the data itself, but its purpose and granularity: does a row represent a user, an order, an order line item, or an event?
This question determines whether all subsequent checks are meaningful. Duplicate order IDs do not necessarily indicate dirty data; they might be valid line items. If the granularity is misjudged, deduplication could delete valid records, turning a correct data source into incorrect analytical input.
The source material requires first confirming: what the dataset represents, the expected granularity, primary or candidate keys, important date columns, timezone assumptions, domain rules, allowed values, and business thresholds. Missing context should be cautiously inferred and marked as an assumption rather than silently filled in.
Select quality checks based on data morphology
After confirming granularity, select high-value checks. The default coverage provided by the source includes completeness, uniqueness, validity, consistency, integrity constraints, timeliness, volume, and morphology.
It also prioritizes different checks based on data morphology:
| Data Morphology | Typical Checks |
|---|---|
| Event Data | Duplicate event IDs, future timestamps, gaps in session or user coverage, sudden structural changes post-deployment |
| Dimension Tables | Non-unique business keys, orphan surrogate keys, status changes lacking timestamps, anomalous loss of reference values |
| Fact Tables | Mixed granularity, impossible magnitudes (negative revenue), join explosion, late or partially loaded partitions |
| Feature and Scoring Tables | Result field leakage, sudden spikes in feature sparsity, distribution drift after model changes, label drift |
| Experiment Data | Duplicate traffic splitting, unbalanced grouping, exposure without splitting, events occurring before the split timestamp |
A critical methodology: compare ratios, not just counts. 1,000 nulls mean something entirely different in a table with one billion rows versus one with one hundred thousand. Furthermore, grouping by time, source, country, platform, and model version is essential to distinguish real issues from expected fluctuations.
Quality reports must explain impact
“Found nulls” is merely a check result, not a quality report.
A more useful approach describes: which dates, sources, and user segments are affected; whether the denominator changes; whether joins will lose rows; or whether dashboards will lag. The source material requires binding each finding to downstream risks: undermining credible analysis, causing biased decisions, breaking joins, expiring dashboards, invalidating experiments, making model features unreliable, or distorting segmentation conclusions.
Each finding should include evidence, risk, severity, confidence level, and a minimal remediation suggestion, while preserving the SQL or Notebook used. The source material adopts a restrained stance on automation: stable rules are suitable for automated tests, but volatile metrics should not be bound by rigid thresholds.
An easily overlooked intermediate layer
Beyond granularity, there is another category of issues most easily missed: completeness over time.
When users mention “starting from a certain day,” “suddenly,” or “only appearing recently,” the source material prioritizes temporal diagnostics: first appearance date, last appearance date, trends in daily or weekly null rates, duplication rate trends, row count trends, category share changes, distribution drift, and change points surrounding deployments, migrations, incidents, model updates, and backfills.
These checks are crucial because many perceived “business changes” are actually collection or pipeline changes. Interpreting them as business issues wastes significant time and leads to incorrect conclusions.
Next, ask if the analysis supports the decision
The object of Validate Data is the analysis, charts, reports, and recommendations—not the data tables themselves.
It begins by extracting key claims: the primary problem, audience, decision, headline numbers, data sources, time windows, segments, filters, comparison baselines, and declared limitations. It then verifies the methodology: do the segments, eligibility rules, exclusions, sampling, metric definitions, formulas, units, denominators, timezones, cohorts, comparison periods, and baselines align with this decision?
The source material specifically highlights several hidden issues: concealed exclusions, inconsistent definitions, partial-period comparisons, and causal phrasing lacking experimental or reliable causal evidence.
Recalculate independently rather than re-reading
Validate Data requires independently recalculating the most impactful numbers to check granularity, subtotals, denominators, non-zero denominators, ratio bases, month-over-month bases, weighted averages, units, currencies, timezone handling, and whether mutually exclusive categories sum to the total.
For SQL, also verify join types, Group By granularity, filters, distinct counts, and row count changes before and after joins.
Teaching example: Channel A has 9 conversions and 10 visits (90% conversion rate); Channel B has 50 conversions and 100 visits (50% conversion rate). Averaging the two rates directly yields 70%, but the overall rate should be 59 ÷ 110 ≈ 53.6%. The records are correct, but the averaging method is wrong.
This error is common because every row appears correct in isolation. Only by documenting the aggregation logic can it be detected.
Charts are also subjects of validation
The source material includes visual presentation within the validation scope: chart type, scale, axes, intervals, titles, labels, units, sorting, annotations, colors, and precision.
The goal is to check whether a reader skimming quickly would take away a wrong impression, particularly regarding truncated axes, dual axes, 3D effects, inconsistent time intervals, missing date ranges, and titles that exaggerate the data.
For already rendered reports, dashboards, slides, documents, or HTML, verify the actual output: are charts broken, tables missing, text cropped, formatting garbled, or placeholder content left behind?
Validation results determine delivery
The source material outlines three tiers of conclusions: shareable, shareable with limitations noted, and requires correction.
If key numbers, denominators, joins, time windows, segments, comparisons, or conclusions are substantially unreliable, sharing should be blocked; minor polishing issues need not block delivery. Unrun checks, missing sources, incomplete rendering steps, unresolved data quality risks, and lack of owner confirmation should be recorded separately as handover blockers rather than mixed into general notes.
If validation used SQL, Python, Notebooks, or spreadsheets, record the artifact paths, query links, or tabs to ensure reproducibility.
The order of the two gates
In practice, the typical order is: quality first, then validation. If the input data itself is unusable, all subsequent recalculations are merely calculating errors with precision.
However, reverse scenarios exist: when analysis is complete but results are suspicious, performing Validate Data claim extraction first often faster identifies which table or metric definition needs re-examination.
The first gate proves the data fits this use case; the second gate proves the analysis supports this decision. Credible delivery requires two layers of evidence.
Reference: OpenAI Data Analytics Skills Public Reference Repository