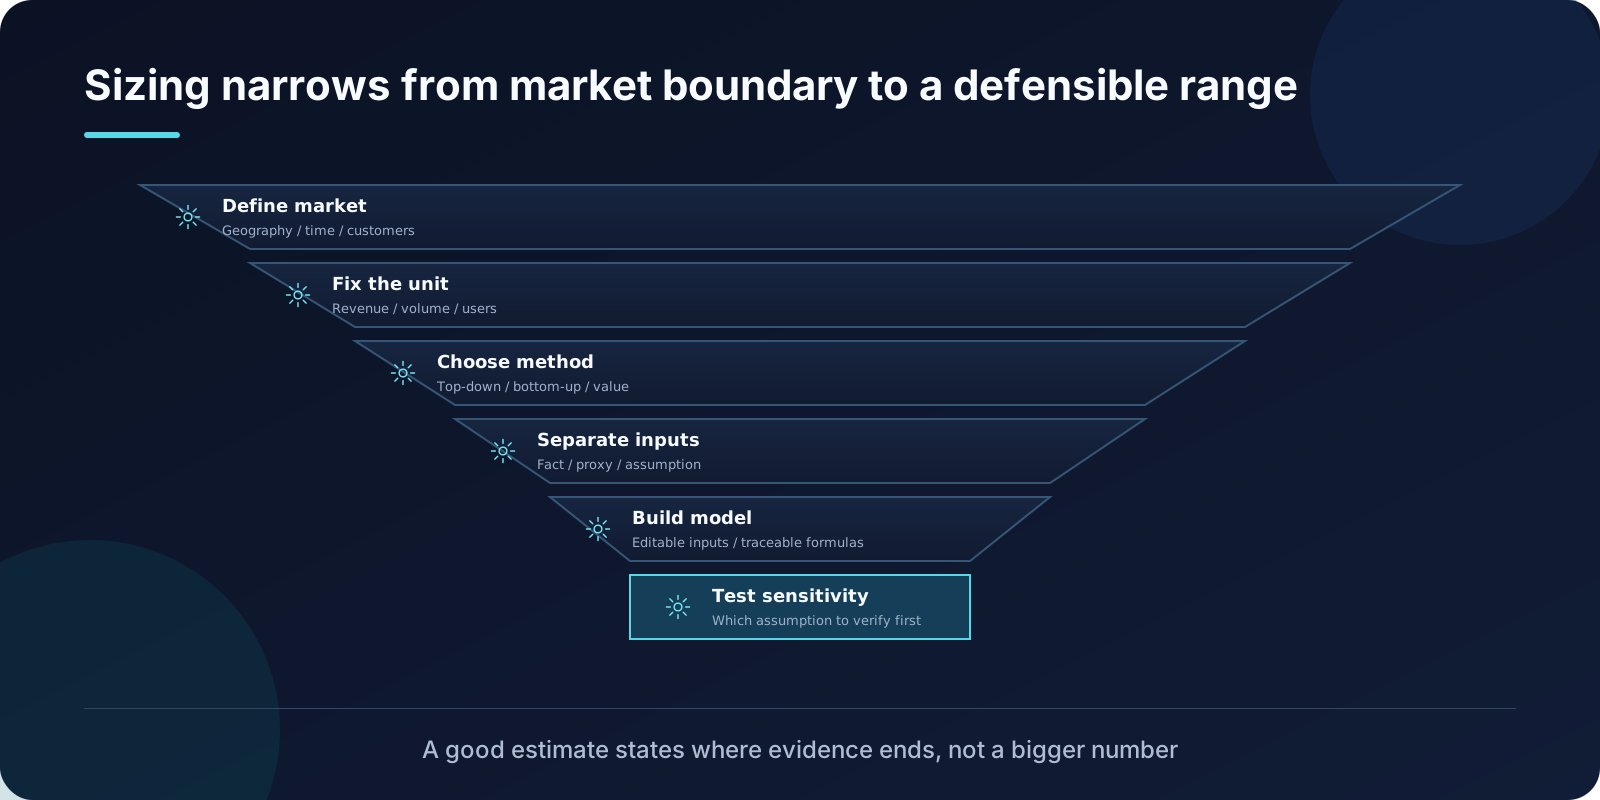
“What is the size of this market?” The most common response from a Data Agent is a number that appears precise. The hardest deliverable is an estimation framework that can be interrogated and adjusted.
The focus of the Market Sizing skill is not to pad answers with zeros, but to ensure scale estimations have boundaries, sources, and assumptions, while explicitly stating where evidence is insufficient when it is lacking.
Clarify what is being estimated first
The source material requires locking down five elements before estimation:
| Element | Content to clarify |
|---|---|
| Object | Product category, workflow, problem, use case, or specific activity type |
| Scope | Region, segment, time horizon, market maturity |
| Members | Who or what counts as being in the market: population, demand units, transaction types |
| Unit | Expenditure, revenue, quantity, value created |
| Question Type | TAM/SAM/SOM, entry opportunity, expansion space, expenditure pool, revenue pool |
This step may appear procedural, but it is the watershed for estimation quality. Estimating “revenue” versus “transaction volume” yields entirely different orders of magnitude; including “prospective customers” in the market versus counting only “paying customers” can shift conclusions by an order of magnitude.
TAM, SAM, and SOM do not need to be fully layered every time. The source material’s stance is to select based on the question’s needs rather than filling out a template.
Choose the simplest, defensible method
The source material outlines three methods, each with distinct applicability conditions:
- Top-down: Decompose from the total when reliable aggregate market data exists.
- Bottom-up: Aggregate from units when the market can be constructed from observable units and assumptions.
- Value-based: Estimate starting from value created rather than from published market totals.
Hybrid methods are suitable for cross-validation, but the source material does not mandate dual calculation every time. Cross-validation is only worthwhile if it substantially increases confidence.
If two paths diverge significantly, the correct action is to first check boundaries, units, coverage, and assumptions, rather than averaging the two results into a “more stable” number. Averaging masks the true source of divergence.
Separate three types of inputs
This is the most practical constraint in the entire skill: distinctly label verified facts, proxy inputs used to substitute direct data, and subjective judgments with their sources and credibility levels.
| Input Type | Examples | Handling Approach |
|---|---|---|
| Verified Facts | Market size from public financial reports, official statistics | Label source and date |
| Proxy Inputs | Using average order value from an adjacent category to substitute for the current category | Explain why substitution is valid and where limitations lie |
| Subjective Assumptions | Adoption rates, penetration speed, conversion ratios | Label as assumptions and provide ranges |
Common distortions occur at the boundaries: industry averages quietly become one’s own transaction prices, prospective customers are treated as paying customers, and pilot conversion rates are extrapolated to full scale.
The source material also sets a hard rule: if a required authoritative source is missing, pause this estimation path and ask the user to supplement or approve an alternative source; do not substitute weaker data as equivalent evidence. If only optional supplementary information is missing, proceed, but flag the gap when it impacts the conclusion.
Models must be modifiable, not just final values
The source material requires models to be auditable and modifiable, containing at least:
- Market definition and units of measurement
- Assumptions and source context
- Calculation chains and derived values
- Base cases, substantive ranges, and sensitivity logic
- Verification priorities
Every major input must show its source path: structured data, contextual channels, public sources, user inputs, or proxy assumptions. Derived values should be traceable to formulas or code, not hard-coded results.
Teaching example: 10,000 enterprises × 40% serviceable ratio × 2,000 yuan annual fee = 8 million yuan annual revenue pool. This is the serviceable scale under the given assumptions, not realized revenue.
Further assume adoption rates of 5%, 10%, and 20%, corresponding to 400,000, 800,000, and 1.6 million yuan. Changing one input changes the conclusion; this variation itself is more valuable than “precision to the unit.”
Sensitivity analysis answers “what to verify first”
The purpose of sensitivity analysis is not to generate more scenarios but to prioritize verification.
The source material recommends: identify inputs that most impact the result, show how the estimation changes as they fluctuate up and down, and prioritize simple, decision-useful analyses over exhaustive scenario enumeration. Use ranges when uncertainty is high; do not mask it with point estimates.
Therefore, a good market estimation should be able to answer at the end:
- How the market is defined and what units are used for measurement.
- What the estimated value or range is.
- What the methods and calculation chains are.
- What the key assumptions are and how each is supported by sources.
- Where the main uncertainties originate.
- Which input should be verified next.
A common failure mode
Treating the estimation as a conclusion rather than as a model pending verification.
Once a number is written into a report, it begins to exist independently of its assumptions: three months later, no one remembers that the 40% serviceable ratio was an estimate; they only remember “the market is 8 million.” This is why the source material insists on making assumptions visible, models modifiable, and sensitivity analysis placed alongside conclusions.
When designing your own estimation process
Three checks you can use immediately:
- Can the estimation object and unit of measurement be clearly stated in one sentence?
- Is every input labeled with its identity (fact, proxy, assumption)?
- If only one more input could be verified, which one should it be and why?
A good market estimation delivers “where current evidence supports us and which new piece of evidence is most likely to change the judgment,” not an untraceable large number.
Reference: OpenAI Data Analytics Skills Public Reference Repository