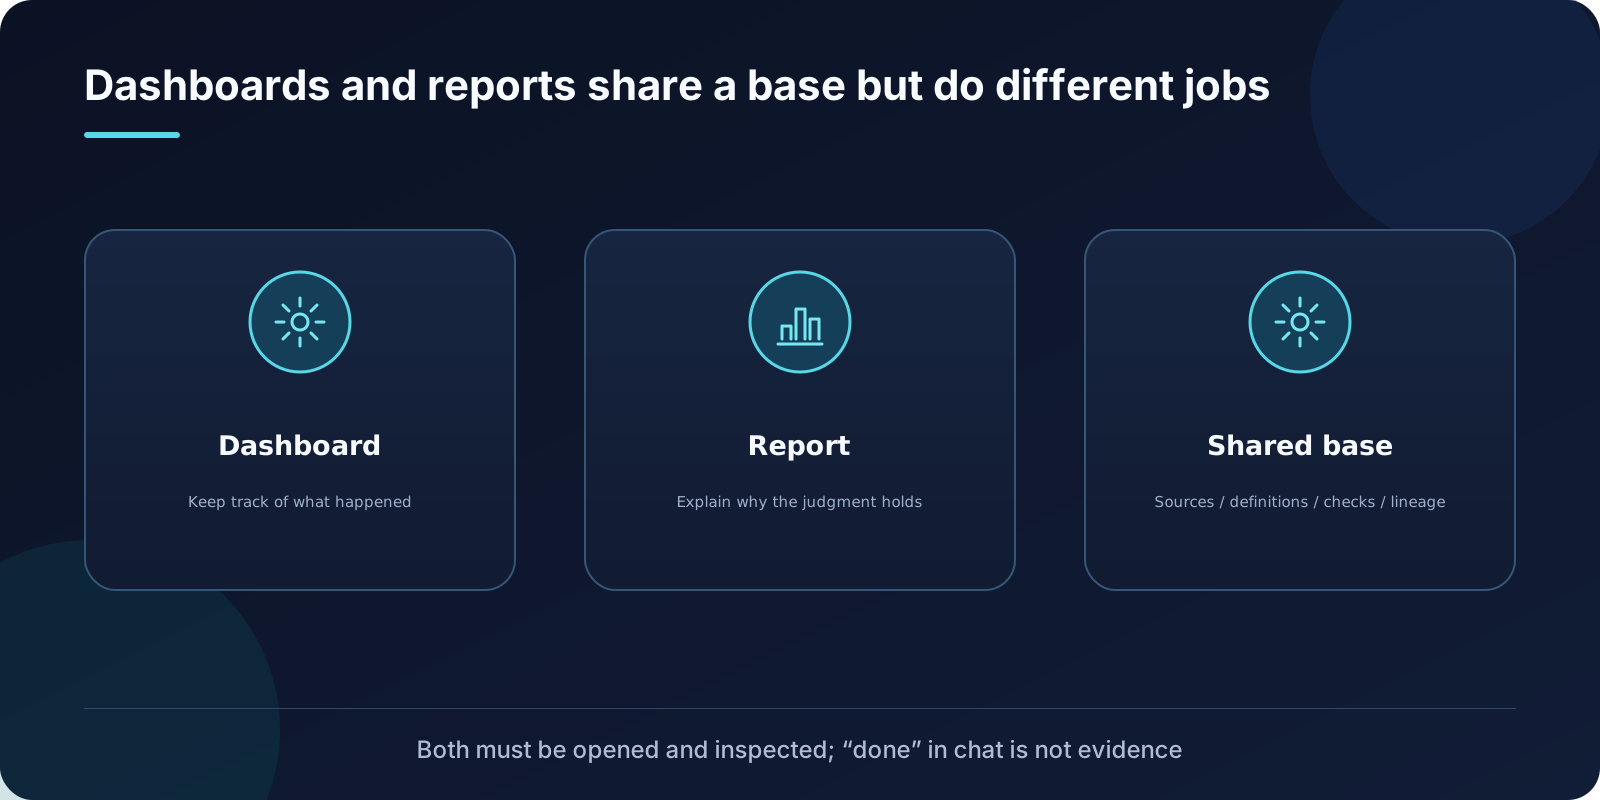
Dashboards and Reports Share Evidence, but Serve Different Jobs
Compare Build Dashboard and Build Report: their audiences, metric models, evidence requirements, acceptance criteria, and delivery conditions.
Knowledge path
Compare Build Dashboard and Build Report: their audiences, metric models, evidence requirements, acceptance criteria, and delivery conditions.
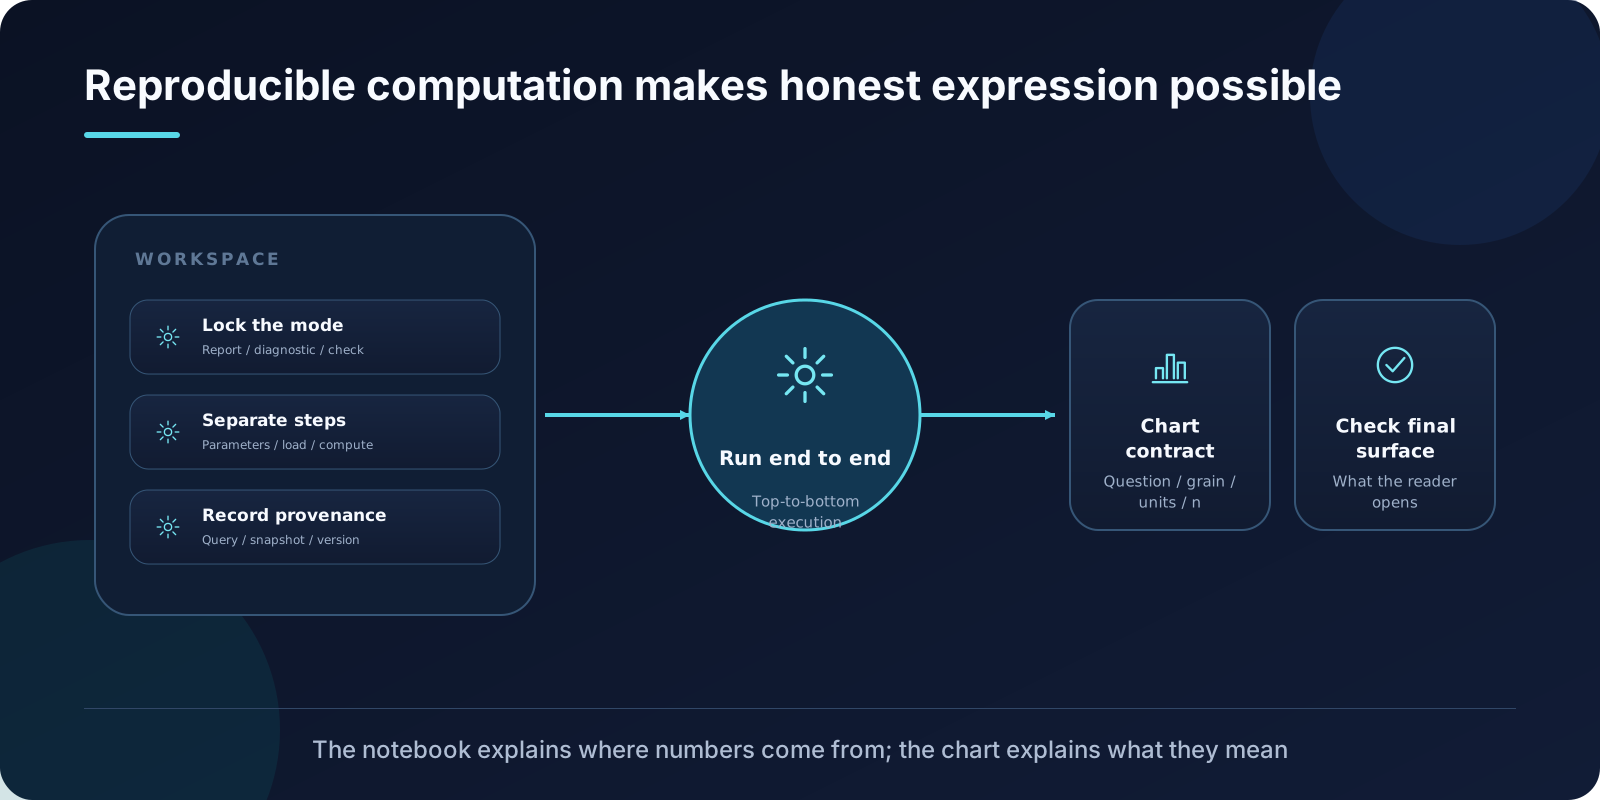
How Jupyter Notebooks and Visualize Data connect reproducible calculations, chart contracts, and honest presentation in a Data Agent workflow.
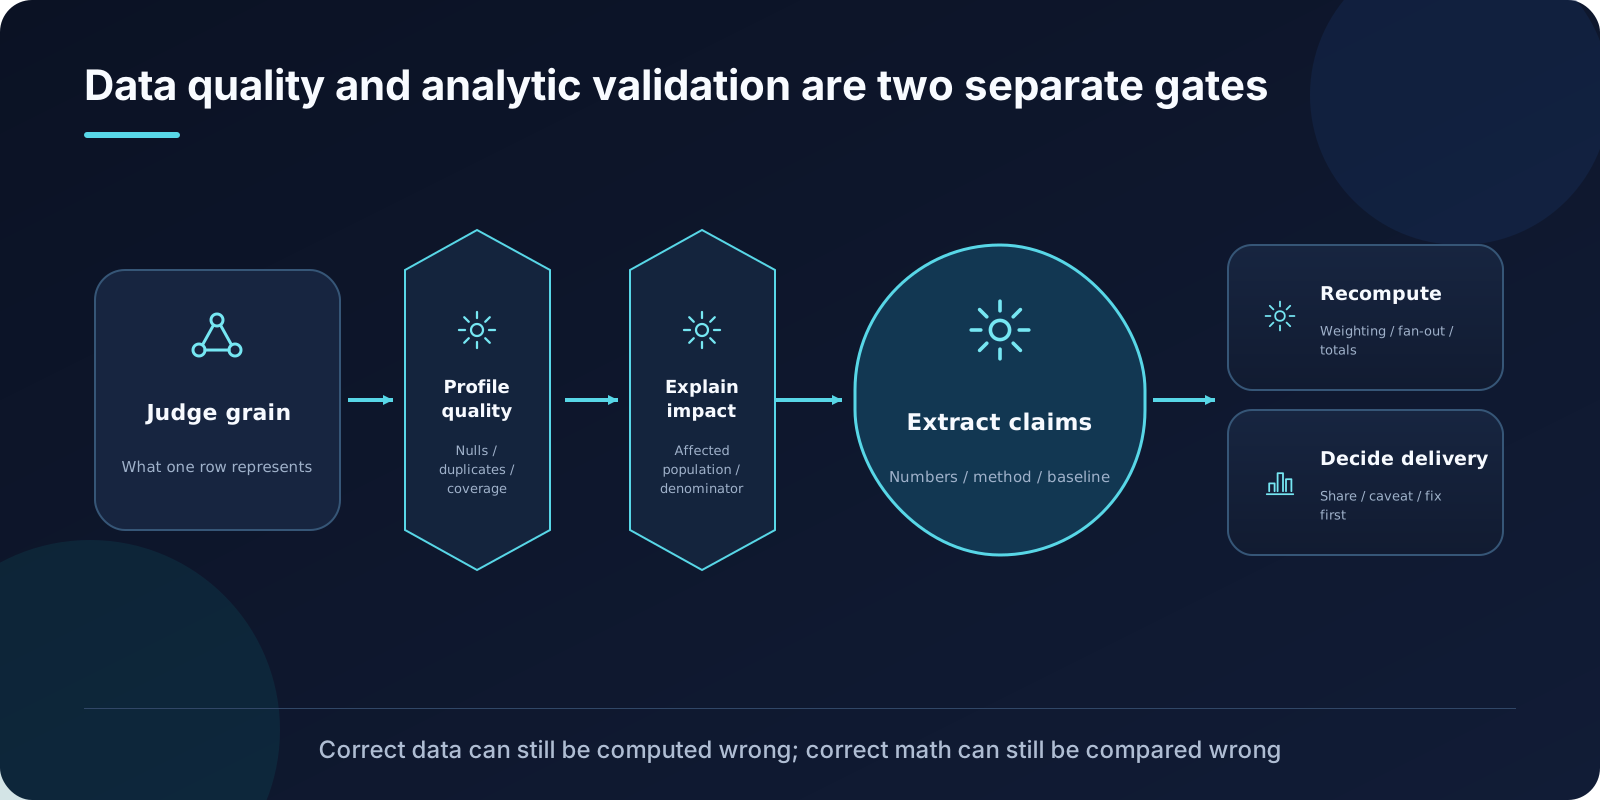
Separate checks on source data from independent checks on analytical claims, including grain, missingness, joins, denominators, and causal interpretation.
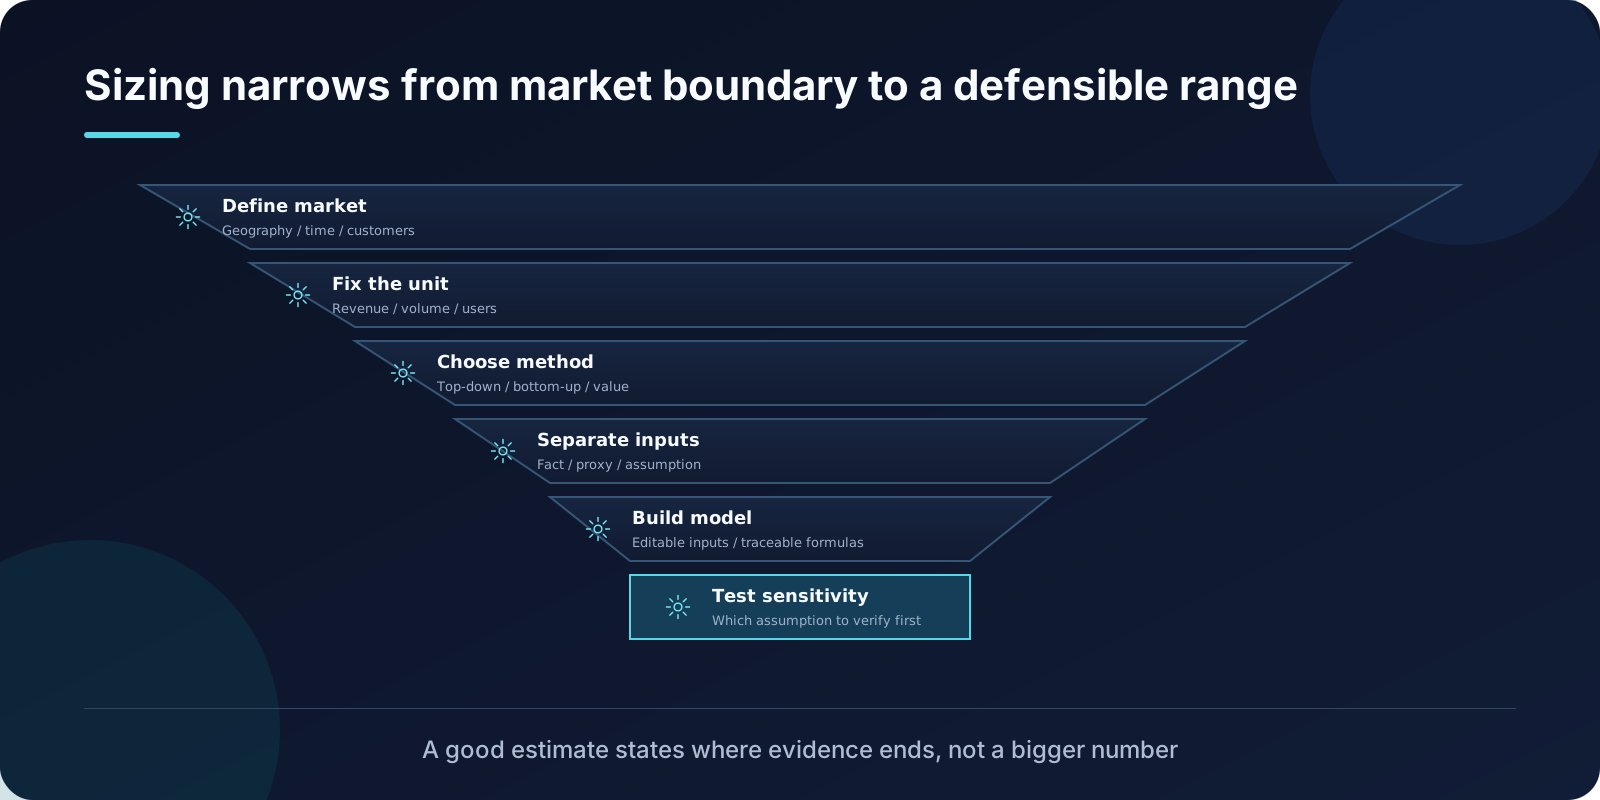
How Market Sizing fixes boundaries and units, separates facts from proxies and assumptions, and uses sensitivity to pick what to verify first.
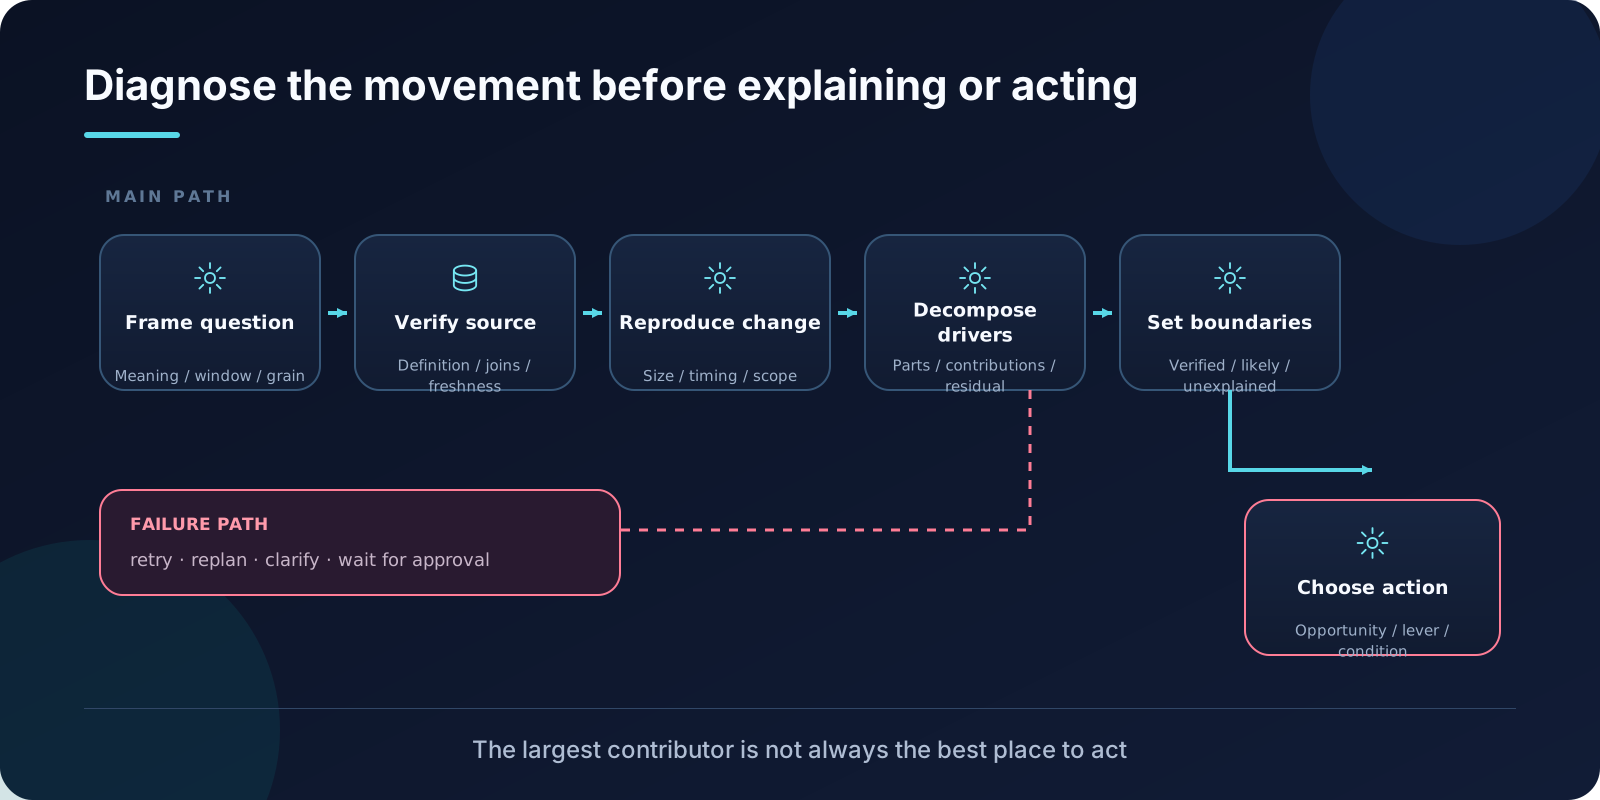
How Metric Diagnostics reproduces a change before explaining it, splits drivers by numerator, denominator, and group, then scopes the cause.
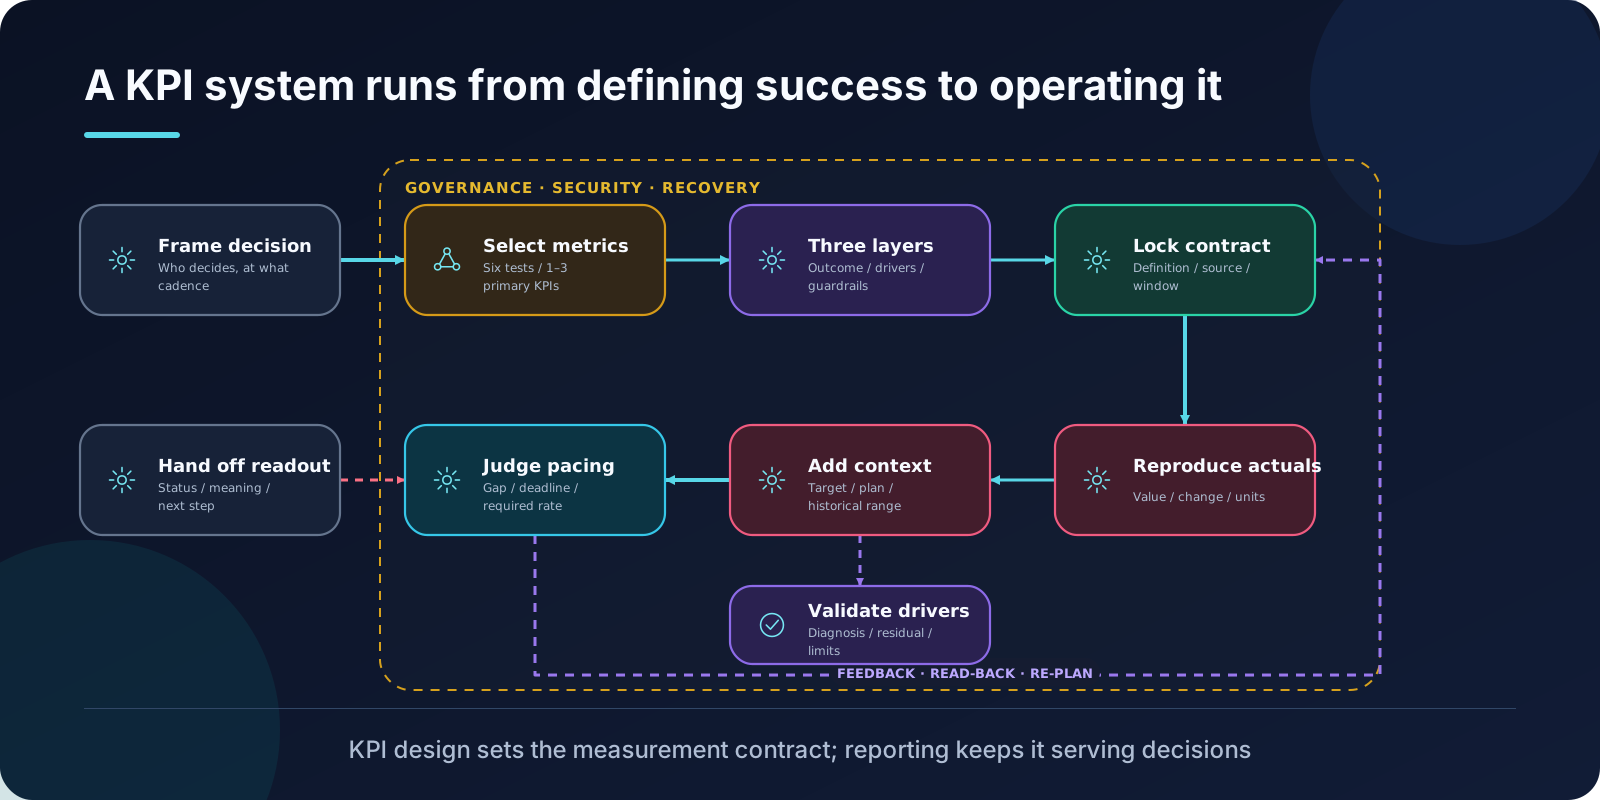
How Design KPIs filters candidate metrics, layers outcomes, drivers, and guardrails, and which six definitions to lock before reporting.
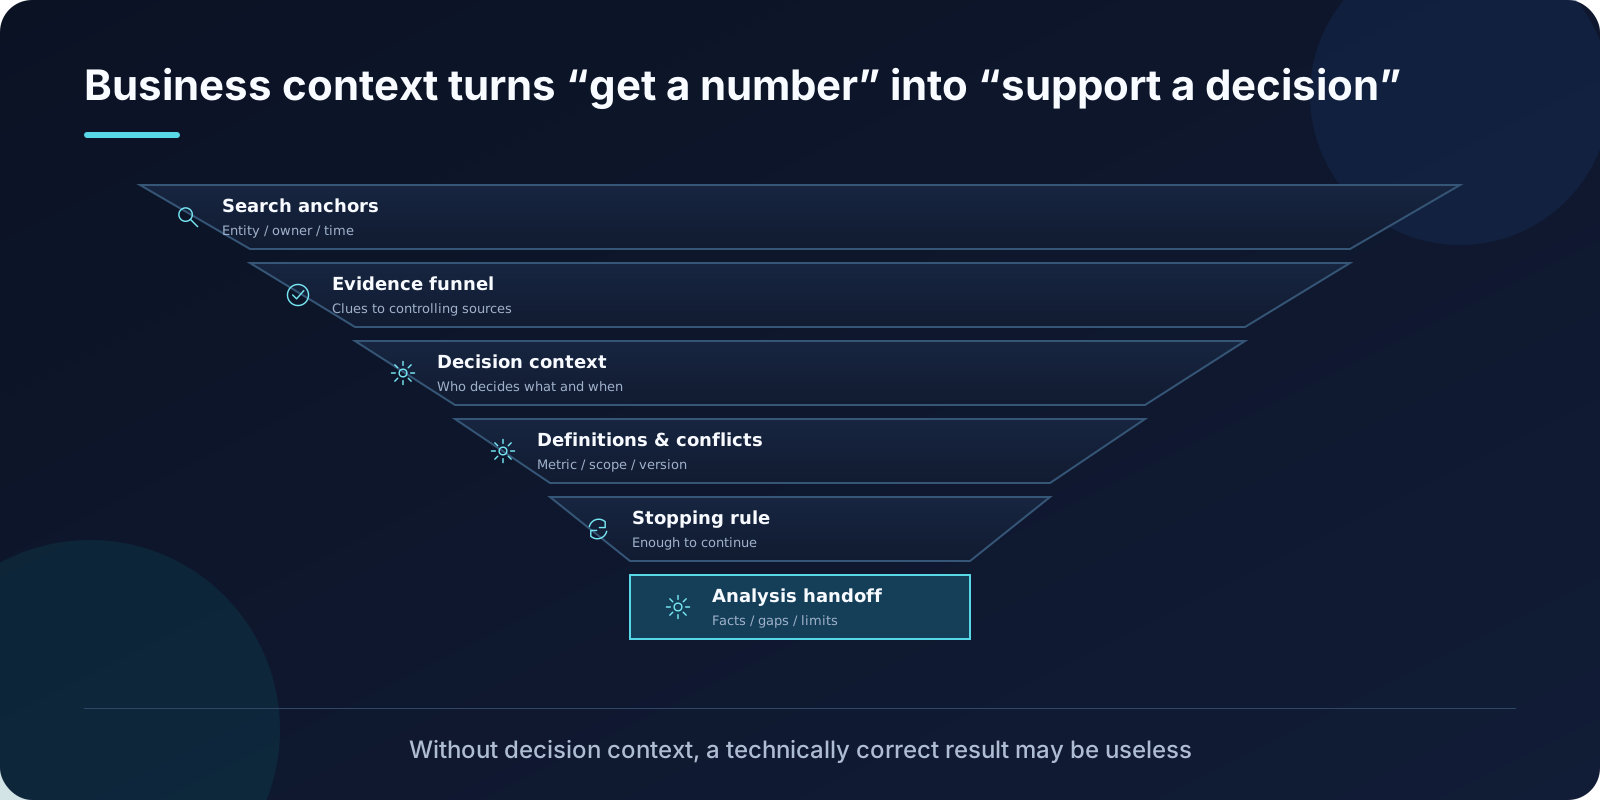
Use search anchors, an evidence funnel, conflict handling, and stopping rules to build a Context Note that keeps a data agent focused on the decision.
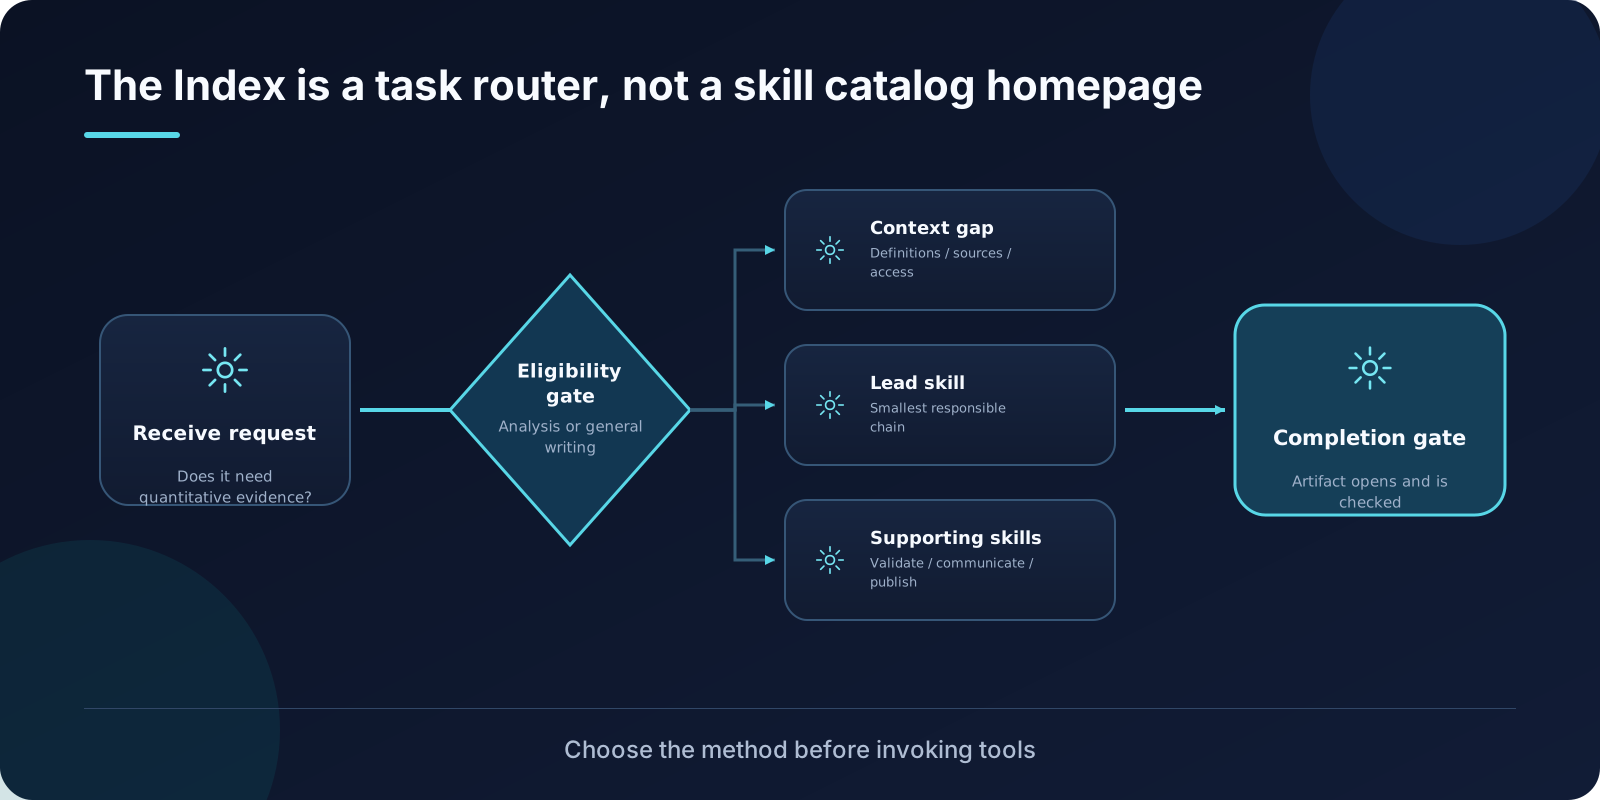
A practical reading of the Data Analytics Index: eligibility, lead-skill routing, source control, delivery routing, and the completion gate.